
S&P 500 stock market index (SPX500, SPTRD, SP 500 or US500) is at Multiple Resistances. What to Expect Now? Let us throw some insights into the important question.
After a tremendous and rapid drop from the all time high of 3,397.20 to 2,184.31, S&P 500 stock market index (SPX500, SP 500) is now facing multiple resistances.
The drop from 3,397.20 to 2,184.31, S&P 500 stock market index (SPX500, SP 500 or US500) is a massive 1,212.89 points which is equal to 35.70% drop in value. This massive drop for S&P 500 stock market index (SPX500, SP 500 or US500) happened in only 22 daily bars from 20-Feb-2020 to 23-Mar-2020. After that S&P 500 stock market index (SPX500, SP 500) has rallied till the time of writing this post to 2,879.57.
Now at this level of 2,879.57 S&P 500 stock market index (SPX500, SP 500 or US500) is facing the following resistances as shown in the chart below:
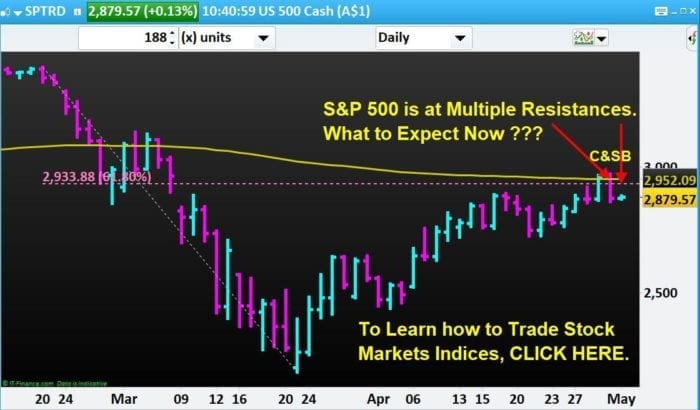
1. 200 period daily exponential moving average
2. 61.8% Fibonacci level
3. Also we observe a Crack & Snap Back phenomenon at point 1 and 2 above.
Now if S&P 500 stock market index (SPX500, SP 500 or US500) is closing below 2,869.09 on a daily basis and its low is taken out then our price objectives are as below:
- 2,815.65
- 2,786.71
- 2,761.88
- 2,747.47
- 2,671.59
- 2,658.59
- 2,590.41
- 2,578.55
- 2,550.98
At N P Financials, we provide more than 18 different ways to assist you to move to the next level in your Trading. Are you exploring the following offerings? If not, start now doing the same:
- Dedicated one-on-one coaching in-house or remote via Skype/ Google hangouts,
- Monthly Class(es) in-house or remote via Skype/ Google hangouts,
- Technical analysis based on Price Action insights/ interpretation (Bar-by-Bar) and/ or Proprietary Indicators/ Strategies which shall make your life easier if you are serious about trading,
- Written Course material (practical, concise and step-by-step guide/ manual) broken down into Modules and Units for your ease,
- Plenty of Real Market examples to make your Trading understanding clearer,
- Self assessment tasks on almost every aspect of Trading taught as well as expert advice on your completed tasks,
- Multi time frame trading model(s) based on momentum swings and market bias,
- Mental Skill Sets required for trading including the control of Cognitive Bias, Amygdala and HPA Axis actions affecting Trading,
- Screen shots of all possible trade set-ups with analysis and commentary,
- Multiple Asset Class evaluations based on Proprietary Market Turning Point indicator,
- Instruction based discussions of high Probability Set-ups with advanced position sizing,
- Mathematical aspects of Trading including positive expectancy, Money/ Risk Management with Proprietary and Logical stop loss,
- Sample Trade Ideas with Outcomes to maximise profit target potential,
- Membership portal with Traders’ breakout room to help develop Trading Plans with a Journal,
- Trading Videos to consolidate your Learning,
- Regular Blog Posts on all aspects of Technical/ Fundamental/ Psychological (Greed/ Fear/ Discipline) Trading,
- Answers to all your questions/ queries.
- Access to our Principal trader over phone/ email/ online chat/ face-to-face/ Skype/ Google hangouts and much more…
To take advantage of our proprietary technical analysis and to move to the next level in your trading journey, and to be good at trading the stock market indices, click here.
Our Unique, Proprietary and most accurate Trader Foundation Course has the capability to identify these markets’ price objectives at a regular interval which we share with our Paid Clients.
To Trade Stock Markets Indices and Forex Pairs in the Professional way and to find out the answers to all your Trading related queries, please contact us at +61 3 9790 6476 and book your FREE discussion session for 30 minutes at Level 3, 2 Brandon Park Drive, Wheelers Hill, Victoria 3150.
Our Post dated March, 29 2020:
Crisis Presents Opportunity. This is the perfect time to convert the present crisis situation into Opportunity by Learning from your Home how to Trade Forex, Shares. You can do this by enrolling in our Online Crash Course Now.
Most of us are experiencing the world wide crisis as of now. Lock down is forcing people to either work from home or be at home till further notice.You can convert this crisis into an Opportunity by investing on yourself to learn a new skill, viz. Learning from your Home how to Trade Forex, Shares, Indices, Commodities.
As a special case we have developed the Online Crash Course to convert this crisis into an Opportunity.
We are offering Online Crash Courses on:
1. Forex
2. Shares
3. Commodities
4. Indices
Much before this crisis started to happen in world wide stock markets precisely from 24.02.2020, we were highlighting its possibility (weakness in world wide Stock Markets) through our various posts dated 23.02.2020; 27.01.2020; 25.11.2019.
We all know that Crisis Presents in disguise an Opportunity. At the time of writing this post, world wide Stock Markets, Indices Markets have already crashed 30-42%, and thereby producing Volatility which is considered to be a Friend of Traders. This crisis in the Market can be turned into our favour even if Market decides to continue to correct itself further or swings back to the upside for the time being to regain a portion of the huge loss reported earlier. No one knows what will happen in the future, but you can decide to invest in yourself to learn a new skill, viz. Learning from your Home Online how to Trade Forex, Shares, Indices, Commodities.
Our Online Crash Course will guide you through every step of your trading in all the asset classes viz. Shares, Forex, Commodities, Bond and Indices e.g. DAX, ASX200, Dow Jones etc to explore the possibility of earning second income. Develop yourself as a professional trader capable of capturing extra income in future with us.
If you are serious about investing on yourself to learn a new skill, viz. Learning from your Home how to Trade Forex, Shares, Indices, Commodities, please Call us at +61 3 9790 6476
email: [email protected]