The most pertinent question in worldwide stock markets’ traders mind now: Is this Market- S&P500 (SP500) want to go up? Let’s analyse the same question in this blog post.
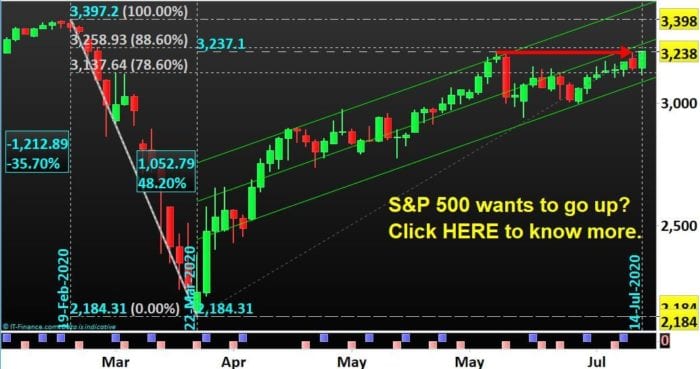
S&P500 (SP500) after correcting 35.70% (1,212.89 points) during Covid-19 i.e from 19-Feb-2020 to 22-Mar-2020, has come back sharply, doing a “V” shaped recovery, 1,052.79 points.
This is a speedy 86.8% recovery which has happened within a short period from 23-Mar-2020 till date for S&P500 (SP500). During this run up, S&P500 (SP500) had printed a significant swing high on 08-Jun-2020 at 3,233.29. This swing high is still acting as a Resistance.
At the time of writing this blog post, S&P500 (SP500) is trading at the vicinity of this Resistance. If the last running bar of S&P500 (SP500) closes above the Resistance at 3,233.29 at today’s close and next bar takes the high of it then we can expect S&P500 (SP500) to go higher up to the levels captured below:
1. 3,238.44
2. 3,258.93
3. 3,311.38
4. 3,384.31
5. 3,397.20
However, we need to be extremely careful to observe that this Market, S&P500 (SP500) is not doing a fake out at these Resistance points as mentioned above. Also we need to be observant about S&P500 (SP500) not doing Crack and Snap back at these Resistance points. In that case it can trigger a downside correction for this Market.
To know the possible answer to this critical question and to take advantage of our proprietary Advance technical analysis so that you can move to the next level in your trading journey and be good at trading the stock market indices, click here.
Our Unique, Proprietary and most accurate Trader Foundation Course has the capability to identify these markets’ price objectives at a regular interval which we share with our Paid Clients.
To Trade Stock Markets Indices in the Professional way and to find out the answers to all your Trading related queries, please contact us at +61 3 9790 6476 and book your FREE discussion session for 30 minutes at Level 3, 2 Brandon Park Drive, Wheelers Hill, Victoria 3150.
Our Blog Post dated June, 14 2020:
How to Trade Stock Index now? In this blog post for how to Trade Stock Index we will analyse the situation for US 500 Cash- S&P500 and Wall Street Cash (Dow Jones 30) both of them are in Over Bought territory.
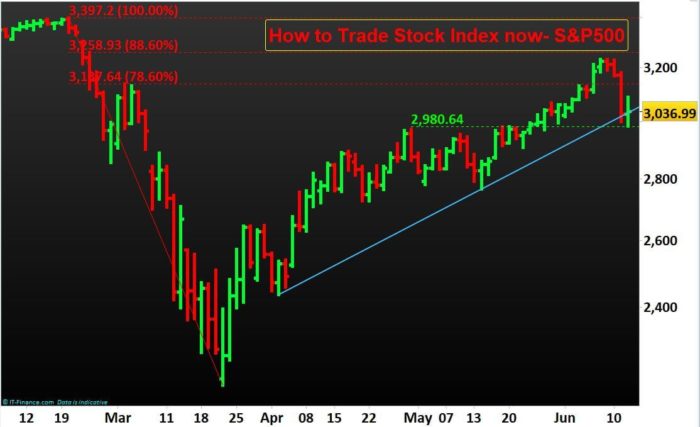
For how to Trade Stock Index (S&P500) after Corona attack in which S&P500 have managed to recover a humongous 86.8% (not a Fibonacci ratio), we are observing that the stock index US 500 cash (S&P500) after struggling with the Fibonacci ratio of 88.6% is now back down below the Fibonacci ratio of 78.6% (which was at 3,137.64) and is now trading at 3,036.99 price level as shown in the chart. The Fibonacci Retracement is drawn from the swing high of 20-Feb-2020 to the swing low of 23-Mar-2020. Price of S&P500 did went up the 78.6% Fib ratio and immediately snapped back below the important ratio. At N P Financials, we call it a “Crack & Snap Back” phenomenon.
When you are interested to know how to Trade Stock Index now for S&P500 after the “Crack & Snap Back” phenomenon, there are couple of observations as below:
a. S&P500 for the last 2 days is closing above the trend line drawn from the swing low of 02-Apr-2020 to the swing low of 14-May-2020.
b.S&P500 for the last 2 days is closing above the support line drawn from the swing high of 19-May-2020.
For how to Trade Stock Index now, if S&P500 is closing below the price level of 2,980.64 and then its low is taken out then the price objectives for S&P500 Stock Index can be projected as below:
1. 2,965.30
2. 2,920.25
3. 2,861.25
4. 2,827.04
5. 2,765.53
6. 2,704.30
7. 2,661.78
8. 2,607.44
9. 2,581.59
10. 2,557.73
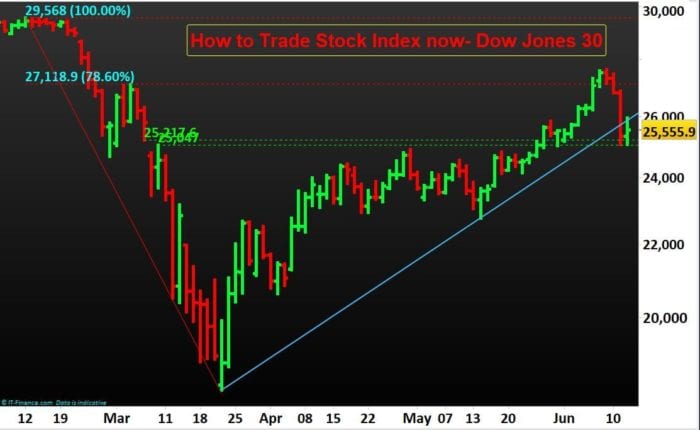
For how to Trade Stock Index (DJI30) after Corona attack in which DJI30 have managed to recover a humongous 83.1% (not a Fibonacci ratio), we are observing that the stock index Wall Street Cash (DJI30) after struglling with the Fibonacci ratio of 78.6% is now back down below the Fibonacci ratio of 78.6% (which was at 27,118.90) and is now trading at 25,555.90 price level as shown in the chart. The Fibonacci Retracement is drawn from the swing high of 12-Feb-2020 to the swing low of 23-Mar-2020. Price of DJI30 did went up the 78.6% Fib ratio and immediately snapped back below the important ratio. At N P Financials, we call it a “Crack & Snap Back” phenomenon.
When you are interested to know how to Trade Stock Index now for DJI30 after the “Crack & Snap Back” phenomenon, there are couple of observations as below:
a. DJI30 for the last 2 days is closing below the trend line drawn from the swing low of 23-Mar-2020 to the swing low of 14-May-2020.
b. DJI30 for the last 2 days is closing above the support line drawn from the swing high of 10-Mar-2020. We can also observe the “Gap” here between 25,217.60 and 25,047 price level which is acting as a support as of now.
For how to Trade Stock Index now, if DJI30 is closing below the price level of 25,047 and then its low is taken out then the price objectives for DJI30 Stock Index can be projected as below:
1. 24,959.60
2. 24,715.60
3. 23,822.60
4. 23,588.80
5. 22,921.60
6. 22,785
7. 22,131.9
8. 21,809.60
9. 21,658.30
10. 20,634
Now the big question: how you can trade S&P500 and DJI30 going forward to repeat our success.
To know the possible answer to this critical question and to take advantage of our proprietary Advance technical analysis so that you can move to the next level in your trading journey and be good at trading the stock market indices, click here.
Our Unique, Proprietary and most accurate Trader Foundation Course has the capability to identify these markets’ price objectives at a regular interval which we share with our Paid Clients.
To Trade Stock Markets Indices in the Professional way and to find out the answers to all your Trading related queries, please contact us at +61 3 9790 6476 and book your FREE discussion session for 30 minutes at Level 3, 2 Brandon Park Drive, Wheelers Hill, Victoria 3150.
Our Blog Post dated May, 24 2020:
GFC, Corona, Fibonacci and S&P500 as of Now: this is the topic of our Blog Post this week. In this post, let us highlight the similarities between Market conditions during GFC and Corona virus pandemic. We will analyse the 2 situations (GFC and Corona) for the world’s biggest stock index S&P500. We will demonstrate these conditions through the use of the powerful Fibonacci Ratio (0.618 or 61.8% which is the inverse of the Golden Ratio 1.618 or 161.8%).
As we all know by now, during GFC (2007-2008), S&P500 corrected itself from the high of 1,575.75 to a low of 666.43. This was a correction of 57.71% or 909.32 points in 1 year and 4 months. During Corona virus pandemic, S&P500 has corrected (so far) from the high of 3,397.20 to a low of 2,184.31. This is a correction of 35.70% or 1,212.89 points from the top in only 1 month and 3 days.
Now the Similarities between Market conditions during GFC and Corona virus pandemic: On 26-Apr-2010 during recovery from GFC, S&P500 faced the resistance at 61.8% Fibonacci Level which was at 1,228.39 (refer7 left hand side of the chart). Exactly from that point and that day, S&P500 came down 16.75% or 203.25 points during next 2 months and 4 days. Now during Corona virus pandemic, S&P500 is facing the same resistance at same 61.8% Fibonacci Level which is currently at 2,933.88 price level. S&P500 has already interacted and is now, at the time of writing this blog post, interacting with this 61.8% Fibonacci Level at 2,933.88. From 29th April 2020 till date, during Corona virus pandemic, price of S&P500 has got rejected 2 times from the 61.8% Fibonacci level as below:
1. first on 30th April 2020 and then on
2. 11th May 2020.
Within last 5 days of during Corona virus pandemic i.e. from 18-May-2020 till 22-May-2020, S&P500 has closed once below the 61.8% Fibonacci level and 4 times above the 61.8% Fibonacci level.
Now the big question: is S&P500 going to repeat the same price action during the Corona virus pandemic as it did during GFC? Or this time S&P500 will follow some other way and do something different than that of GFC?
To know the possible answer to this critical question and to take advantage of our proprietary technical analysis so that you can move to the next level in your trading journey and be good at trading the stock market indices, click here.
Our Unique, Proprietary and most accurate Trader Foundation Course has the capability to identify these markets’ price objectives at a regular interval which we share with our Paid Clients.
To Trade Stock Markets Indices in the Professional way and to find out the answers to all your Trading related queries, please contact us at +61 3 9790 6476 and book your FREE discussion session for 30 minutes at Level 3, 2 Brandon Park Drive, Wheelers Hill, Victoria 3150.
Our Post dated May, 01 2020:
S&P 500 stock market index (SPX500, SPTRD, SP 500 or US500) is at Multiple Resistances. What to Expect Now? Let us throw some insights into the important question.
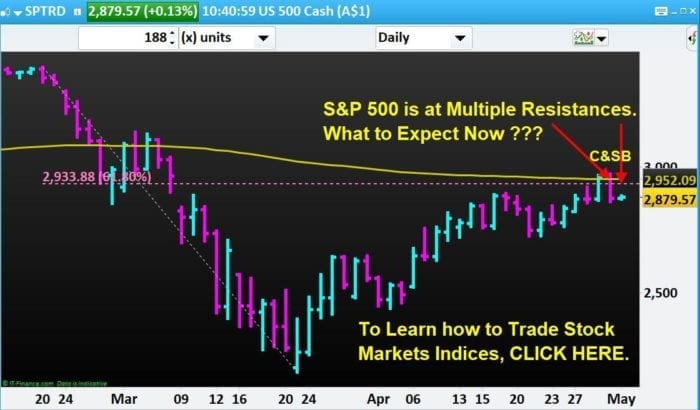
After a tremendous and rapid drop from the all time high of 3,397.20 to 2,184.31, S&P 500 stock market index (SPX500, SP 500) is now facing multiple resistances.
The drop from 3,397.20 to 2,184.31, S&P 500 stock market index (SPX500, SP 500 or US500) is a massive 1,212.89 points which is equal to 35.70% drop in value. This massive drop for S&P 500 stock market index (SPX500, SP 500 or US500) happened in only 22 daily bars from 20-Feb-2020 to 23-Mar-2020. After that S&P 500 stock market index (SPX500, SP 500) has rallied till the time of writing this post to 2,879.57.
Now at this level of 2,879.57 S&P 500 stock market index (SPX500, SP 500 or US500) is facing the following resistances as shown in the chart below:
1. 200 period daily exponential moving average
2. 61.8% Fibonacci level
3. Also we observe a Crack & Snap Back phenomenon at point 1 and 2 above.
Now if S&P 500 stock market index (SPX500, SP 500 or US500) is closing below 2,869.09 on a daily basis and its low is taken out then our price objectives are as below:
- 2,815.65
- 2,786.71
- 2,761.88
- 2,747.47
- 2,671.59
- 2,658.59
- 2,590.41
- 2,578.55
- 2,550.98
At N P Financials, we provide more than 18 different ways to assist you to move to the next level in your Trading. Are you exploring the following offerings? If not, start now doing the same:
- Dedicated one-on-one coaching in-house or remote via Skype/ Google hangouts,
- Monthly Class(es) in-house or remote via Skype/ Google hangouts,
- Technical analysis based on Price Action insights/ interpretation (Bar-by-Bar) and/ or Proprietary Indicators/ Strategies which shall make your life easier if you are serious about trading,
- Written Course material (practical, concise and step-by-step guide/ manual) broken down into Modules and Units for your ease,
- Plenty of Real Market examples to make your Trading understanding clearer,
- Self assessment tasks on almost every aspect of Trading taught as well as expert advice on your completed tasks,
- Multi time frame trading model(s) based on momentum swings and market bias,
- Mental Skill Sets required for trading including the control of Cognitive Bias, Amygdala and HPA Axis actions affecting Trading,
- Screen shots of all possible trade set-ups with analysis and commentary,
- Multiple Asset Class evaluations based on Proprietary Market Turning Point indicator,
- Instruction based discussions of high Probability Set-ups with advanced position sizing,
- Mathematical aspects of Trading including positive expectancy, Money/ Risk Management with Proprietary and Logical stop loss,
- Sample Trade Ideas with Outcomes to maximise profit target potential,
- Membership portal with Traders’ breakout room to help develop Trading Plans with a Journal,
- Trading Videos to consolidate your Learning,
- Regular Blog Posts on all aspects of Technical/ Fundamental/ Psychological (Greed/ Fear/ Discipline) Trading,
- Answers to all your questions/ queries.
- Access to our Principal trader over phone/ email/ online chat/ face-to-face/ Skype/ Google hangouts and much more…
To take advantage of our proprietary technical analysis and to move to the next level in your trading journey, and to be good at trading the stock market indices, click here.
Our Unique, Proprietary and most accurate Trader Foundation Course has the capability to identify these markets’ price objectives at a regular interval which we share with our Paid Clients.
To Trade Stock Markets Indices and Forex Pairs in the Professional way and to find out the answers to all your Trading related queries, please contact us at +61 3 9790 6476 and book your FREE discussion session for 30 minutes at Level 3, 2 Brandon Park Drive, Wheelers Hill, Victoria 3150.

