Weaknesses can be observed in Australia 200 (ASX200) and Hong Kong 50 (HK50) Stock Indices as of now. Now What to Expect? The question is extremely relevant in the present stock indices markets. Let’s find out the answer through this blog post.
1. Analysis of Hong Kong 50 (HK50) Stock Index:
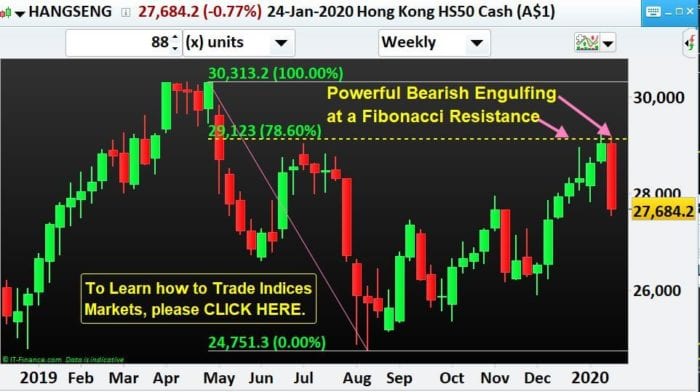
Hong Kong 50 (HK50) Stock Index has printed a massive Bearish Engulfing Candlestick in the weekly chart as shown in the chart last week (week number 04). This week number 04’s Candlestick can be considered to be a powerful bearish reversal candle since it has engulfed the bodies of week number 52 (2019), week number 01, 02 and 03 (2020). So this weekly Candlestick has covered the last 4 weeks Candlestick’s bodies. This type of Candlestick is considered to be very strong, especially when it appears with a context of an existing resistance. This resistance can be observed at 78.6% Fibonacci retracement level as shown. The Fibonacci is drawn from week number 18’s swing high to week number 33’s swing low. When this happens (Strong Bearish Candlestick appearing at a Resistance) there can be a good probability that the price of this Hong Kong 50 (HK50) Stock Index going down.
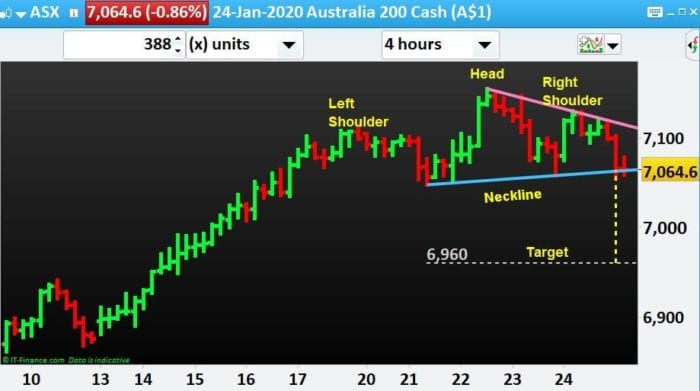
2. Australia 200 (ASX200) Stock Index has printed a possible Head and Shoulder in a four hour time frame and a possible Double top in a Daily time frame chart.
a. The Head of the head and shoulder pattern for Australia 200 (ASX200) Stock Index was formed on 22-Jan-2020 15:00 bar at the swing high of 7,155.2 price level.
b. The Right Shoulder of the head and shoulder pattern for Australia 200 (ASX200) Stock Index was formed on 24-Jan-2020 07:00 bar at the swing high of 7,130.2 price level.
c. The Left Shoulder of the head and shoulder pattern for Australia 200 (ASX200) Stock Index was formed on 18-Jan-2020 07:00 bar at the swing high of 7,110.5 price level.
d. The neck line was drawn joining the in-between (between Head and Left Shoulder and Head and Right Shoulder) swing lows of 21-Jan-2020 11:00 bar and 23-Jan-2020 23:00 bar.
e. The last bit was to draw a vertical line from the neck line to the high of the Head and copy-paste the same vertical line on below the neck line when it was broken (i.e. price crossing below the neck line) to get the target of 6,960 as shown below:
Since both Australia 200 (ASX200) and Hong Kong 50 (HK50) Stock Indices are showing weakness this can be interesting to observe the further move down towards our intended targets.
To take advantage of our proprietary technical analysis and to move to the next level in your trading journey, and to be good at trading the stock market indices, click here.
Our Unique, Proprietary and most accurate Trader Foundation Course has the capability to identify these market turning points at a regular interval which we share with our Paid Clients.
When you are trained by us and learn how to trade Stock Markets Indices by taking advantage of our Knowledge and Expertise in the field, you can be benefited on a regular basis in Stock Markets Indices like Australia 200 (ASX200), China A50 (CHINA50), Hong Kong cash (HK50), Nikkei 225 cash (JP225), France 40 cash (CAC40), Germany 30 cash (DAX30), UK 100 cash (FTSE100), Wall Street 30 cash (WS30) and US SPX 500 cash (US500).
With our Proprietary Trader Foundation Course for Stock Markets Indices like the ASX 200, DJI 30 or DAX 30 Index markets, you can be benefited on a regular basis on ASX 200, DJI 30 or DAX 30 and other Stock Market Indices.
To Trade Stock Markets Indices in the Professional way and to find out the answers to all your Indices Trading related queries, please contact us at 03 9015 4858 and book your FREE discussion session for 30 minutes at Level 3, 2 Brandon Park Drive, Wheelers Hill, Victoria 3150.
We will not only handhold and guide you in the following aspects of the Professional way of Stock Markets Indices Trading but also will actually show you how we Trade Index CFDs for a living:
- Introduction to Trading Different Markets
- Index Market Facts, Timings, and its Framework
- How to take advantage from major Market Participants
- Index Trading Nomenclature
- The relationship between Worldwide Indices
- Dow Jones 30 vs.US Dollar Index
- Swaps, Spread, Slippage
- Fundamentals factors moving Markets
- Order Types, Leverage, Margin
- Trade Risk, Trade Reward, Favorable Reward to Risk
- Account Risk, Basic Position Sizing
- Introduction to Technical Trading
- Index Market Structure
- Market Mechanics and Dynamics
- Market Mapping
- Advance Trade Sizing
- How to identify in advance Market Reversals
- How to evaluate new price action before it unfolds
- Our own proprietary Bar by Bar Market Analysis
- You will come to know What to do & what not to do when
- Our proprietary Money & Risk Management Strategies
- Capital and Portfolio Management System
- Performance Analysis of Bar by Bar Market Analysis
- Professional Trader Mindset including Major Mistakes to be avoided
Now you can trade Share Markets Indices with us to explore the possibility of earning passive income keeping your day job.
Our Proprietary Share Markets Indices Trading Strategies will guide you through every step of your trading in Shares and explore the possibility of earning extra income.
Learn what all other national and international Share Markets Indices we are Trading in our Index Trading Asset Class.
Develop yourself as a professional trader capable of capturing second income in the future with us.
Become a Member to grab these Market Sync based Share Markets Indices Trading Opportunities in the future by clicking here.
Please click on the Contact Us link: Goo.Gl/2SRZoG
Call us on +61 3 9790 6476
email: [email protected]
Learn Share Trading with N P Financials, the Prop Trading Firm at Melbourne
Learn how to Trade the Directional Share Market. Get mentored in the art and science of Share Trading in our proprietary 6 months developmental course. Derive benefit from our effective Share Trading Strategies.
Learn Basics of Forex Trading N P Financials, the Prop Trading Firm at Melbourne
On completion of the “Basics of Trading” course, You will develop an In-depth understanding of Fundamentals factors moving Markets. You will be able to clearly understand the Market Jargon e.g. Swaps, Spread, Slippage etc.
Learn how to Code in Trading N P Financials, the Prop Trading Firm at Melbourne
A full-time professional trader from N P Financials will be your own personal coach for 3-6 months. You will be trained on how to learn the Market Programming Language.
Develop your own Market Scanning System with N P Financials, the Prop Trading Firm at Melbourne
A full-time professional trader from NPF will be your own personal coach for 3-6 months. You will be trained on how to Develop your Market Scanning Edge.
Develop your own Trading System e.g. Stock CFD Trading with N P Financials, the Prop Trading Firm at Melbourne
A full-time professional trader from NPF will be your own personal coach for 3-6 months. You will be trained on how to Build your Trading Edge e.g. Stock CFD Trading