Shares, Stock Indices and Forex Markets are down big time. The only question can be: where to from here? In this blog post we shall show you the Analysis for Opportunities at this perfect time to explore the possibilities to learn and earn.
We have selected the following 5 Markets to analyse for opportunities:
1. ASX 200: Australia 200 Cash Stock Market Index
2. S&P 500: US 500 Stock Market Index
3. US DOLLAR Index: The United States Dollar Basket.
4. AUDUSD: Australian Dollar against the United States Dollar.
5. GBPUSD: Great Britain Pound against the United States Dollar.
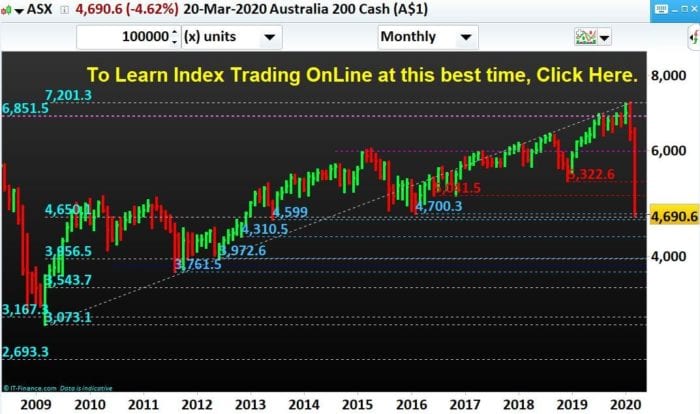
A) Out of the 5 Markets to analyse for opportunities at this perfect time to explore the possibilities to learn and earn, the first instrument is our very own ASX 200 as analysed below:
For ASX 200, the price at the time of writing this blog post is 4,690.6. If this stock market index is staying below 4,700.3 price level and trading below this level in the coming days, our price objective to the down side are as below:
- 4,650.1
- 4,599
- 4,310.5
- 3,972.6
- 3,956.5
If on the other hand ASX 200 stock market index is staying above 4,700.3 price level and trading above this level in the coming days and weeks, our price objective to the up side will be posted in our next blog post(s).
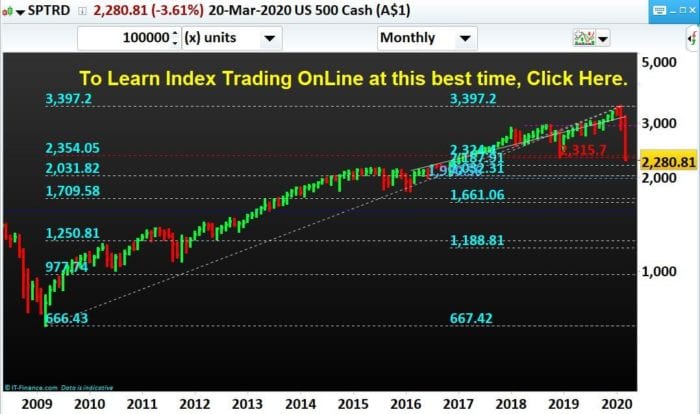
B) Out of the 5 Markets to analyse for opportunities at this perfect time to explore the possibilities to learn and earn, the 2nd instrument is S&P 500 as analysed below:
For S&P 500, the price at the time of writing this blog post is 2,280.81. If S&P 500 stock market index is staying below 2,354.05 price level and trading below this level in the coming days, our price objective to the down side are as below:
- 2,187.91
- 2,032.31
- 2,031.82
- 1,990.56
If on the other hand S&P 500 stock market index is staying above 2,354.05 price level and trading above this level in the coming days and weeks, our price objective to the up side will be posted in our next blog post(s).
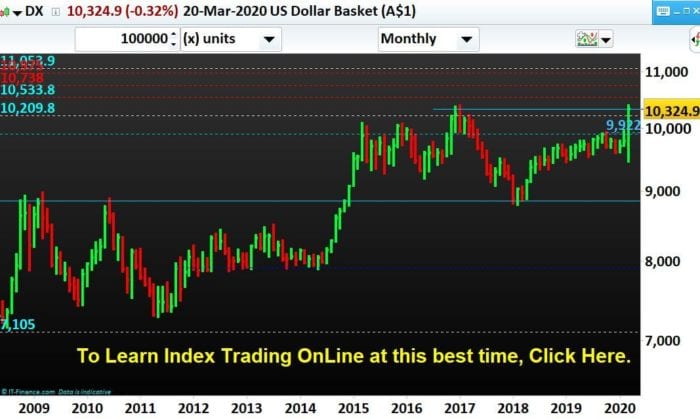
C) Out of the 5 Markets to analyse for opportunities at this perfect time to explore the possibilities to learn and earn, the 3rd instrument is the very important US Dollar Index as analysed below:
For US Dollar Index, the price at the time of writing this blog post is 10,324.9. If this US Dollar market index is staying above 10,380 price level and trading above this level in the coming days, our price objective to the up side are as below:
- 10,533.8
- 10,738
- 10,975
- 11,053.9
If on the other hand US Dollar Index is staying below 10,328.8 price level and trading below this level in the coming days and weeks, our price objective to the down side will be posted in our next blog post(s).
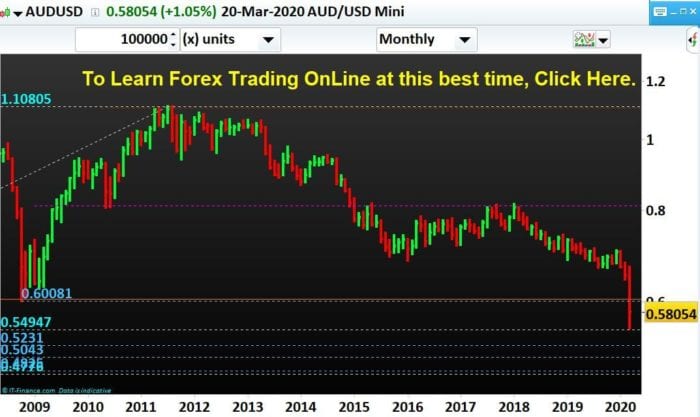
D) Out of the 5 Markets to analyse for opportunities at this perfect time to explore the possibilities to learn and earn, the 4th instrument is the AUDUSD Forex Pair as analysed below:
For AUDUSD Forex pair, the price at the time of writing this blog post is 0.5805. If this AUDUSD Forex pair is staying below 0.6008 price level and trading below this level in the coming days, our price objective to the down side are as below:
- 0.5494
- 0.5231
- 0.5043
- 0.4825
- 0.4776
If on the other hand AUDUSD Forex pair is staying above 0.6008 price level and trading above this level in the coming days and weeks, our price objective to the up side will be posted in our next blog post(s).
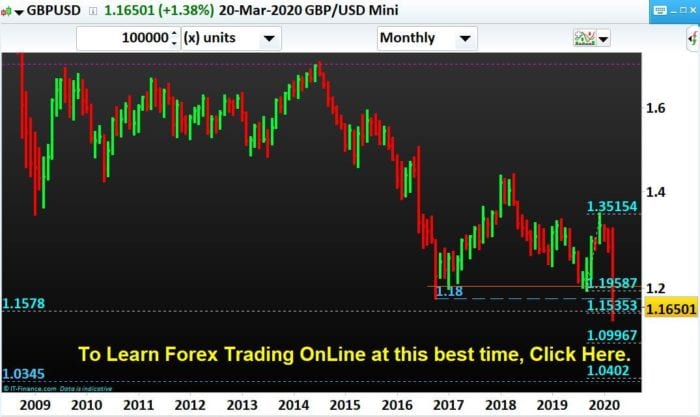
E) Out of the 5 Markets to analyse for opportunities at this perfect time to explore the possibilities to learn and earn, the 5th instrument is the GBPUSD Forex Pair as analysed below:
For GBPUSD Forex pair, the price at the time of writing this blog post is 1.1650. If this GBPUSD Forex pair is staying below 1.1800 price level and trading below this level in the coming days, our price objective to the down side are as below:
- 1.1578
- 1.1535
- 1.0996
- 1.0402
- 1.0345
If on the other hand GBPUSD Forex pair is staying above 1.1800 price level and trading above this level in the coming days and weeks, our price objective to the up side will be posted in our next blog post(s).
At N P Financials, we provide more than 18 different ways to assist you to move to the next level in your Trading. Are you exploring the following offerings? If not, start now doing the same:
- Dedicated one-on-one coaching in-house or remote via Skype/ Google hangouts,
- Monthly Class(es) in-house or remote via Skype/ Google hangouts,
- Technical analysis based on Price Action insights/ interpretation (Bar-by-Bar) and/ or Proprietary Indicators/ Strategies which shall make your life easier if you are serious about trading,
- Written Course material (practical, concise and step-by-step guide/ manual) broken down into Modules and Units for your ease,
- Plenty of Real Market examples to make your Trading understanding clearer,
- Self assessment tasks on almost every aspect of Trading taught as well as expert advice on your completed tasks,
- Multi time frame trading model(s) based on momentum swings and market bias,
- Mental Skill Sets required for trading including the control of Cognitive Bias, Amygdala and HPA Axis actions affecting Trading,
- Screen shots of all possible trade setups with analysis and commentary,
- Multiple Asset Class evaluations based on Proprietary Market Turning Point indicator,
- Instruction based discussions of high Probability Setups with advanced position sizing,
- Mathematical aspects of Trading including positive expectancy, Money/ Risk Management with Proprietary and Logical stop loss,
- Sample Trade Ideas with Outcomes to maximise profit target potential,
- Membership portal with Traders’ breakout room to help develop Trading Plans with a Journal,
- Trading Videos to consolidate your Learning,
- Regular Blog Posts on all aspects of Technical/ Fundamental/ Psychological (Greed/ Fear/ Discipline) Trading,
- Answers to all your questions/ queries.
- Access to our Principal trader over phone/ email/ online chat/ face-to-face/ Skype/ Google hangouts and much more…
To take advantage of our proprietary technical analysis and to move to the next level in your trading journey, and to be good at trading the stock market indices, click here.
Our Unique, Proprietary and most accurate Trader Foundation Course has the capability to identify these markets’ price objectives at a regular interval which we share with our Paid Clients.
To Trade Stock Markets Indices and Forex Pairs in the Professional way and to find out the answers to all your Trading related queries, please contact us at 03 9015 4858 and book your FREE discussion session for 30 minutes at Level 3, 2 Brandon Park Drive, Wheelers Hill, Victoria 3150.
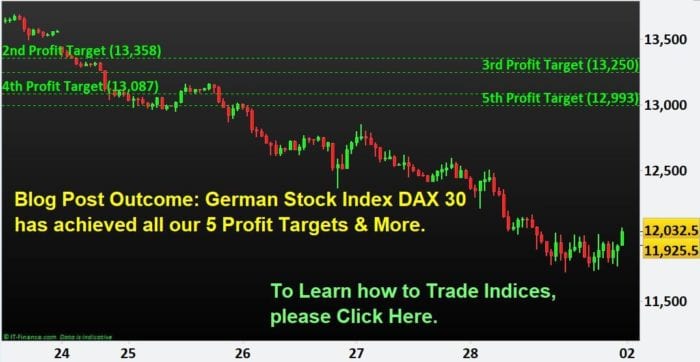
Blog Post Outcome: Germany Stock Index DAX 30 has achieved all of our 5 Profit Targets. In our previous blog post dated February 23, 2020 we wrote, “Our price objectives from this Bearish Bias for German Stock Index DAX 30 are as below:
1. 1st price objective is at 13,470 price level.
2. 2nd price objective is at 13,358 price level.
3. 3rd price objective is at 13,250 price level.
4. 4th price objective is at 13,087 price level.
5. 5th price objective is at 12,993 price level.”
Germany Stock Index DAX 30 has achieved all of our above mentioned 5 profit targets just within one week of our previous blog post dated February 23, 2020, DAX 30.
In this blog post let us highlight, as shown in the 4 hour chart, when DAX 30 achieved all of our 5 profit targets as outlined in our previous blog post dated February 23, 2020, DAX 30:
1. As mentioned in our previous blog post DAX 30 achieved our 1st profit target on 24-Feb-2020 07:00 4 hour bar/ candlestick.
2. As mentioned in our previous blog post DAX 30 achieved our 2nd profit target on 24-Feb-2020 11:00 4 hour bar/ candlestick.
3. As mentioned in our previous blog post DAX 30 achieved our 3rd profit target on 24-Feb-2020 19:00 4 hour bar/ candlestick.
4. As mentioned in our previous blog post DAX 30 achieved our 4th profit target on 24-Feb-2020 19:00 4 hour bar/ candlestick.
5. As mentioned in our previous blog post DAX 30 achieved our 5th profit target on 24-Feb-2020 23:00 4 hour bar/ candlestick.
This is the edge/ special advantage you get when you are trained by us. We are maintaining our BEARISH BIAS on DAX 30 stock index as per our proprietary technical analysis.
To take advantage of our proprietary technical analysis and to move to the next level in your trading journey, and to be good at trading the stock market indices, click here.
Our Unique, Proprietary and most accurate Trader Foundation Course has the capability to identify these market turning points at a regular interval which we share with our Paid Clients.
When you are trained by us and learn how to trade Stock Markets Indices by taking advantage of our Knowledge and Expertise in the field, you can be benefited on a regular basis in Stock Markets Indices like Australia 200 (ASX200), China A50 (CHINA50), Hong Kong cash (HK50), Nikkei 225 cash (JP225), France 40 cash (CAC40), Germany 30 cash (DAX30), UK 100 cash (FTSE100), Wall Street 30 cash (WS30) and US SPX 500 cash (US500).
With our Proprietary Trader Foundation Course for Stock Markets Indices like the ASX 200, DJI 30 or DAX 30 Index markets, you can be benefited on a regular basis on ASX 200, DJI 30 or DAX 30 and other Stock Market Indices.
To Trade Stock Markets Indices in the Professional way and to find out the answers to all your Indices Trading related queries, please contact us at 03 9015 4858 and book your FREE discussion session for 30 minutes at Level 3, 2 Brandon Park Drive, Wheelers Hill, Victoria 3150.
Our Post dated February 23, 2020:
Is it the time for Corrective move down for German Stock Index DAX 30? Weakness can be observed in German Stock Index DAX 30 as of now. Now the question is, What to Expect? The question is extremely relevant in the present stock index markets. Let’s find out the answer through this blog post.
Analysis of German Stock Index DAX 30 Stock Index:
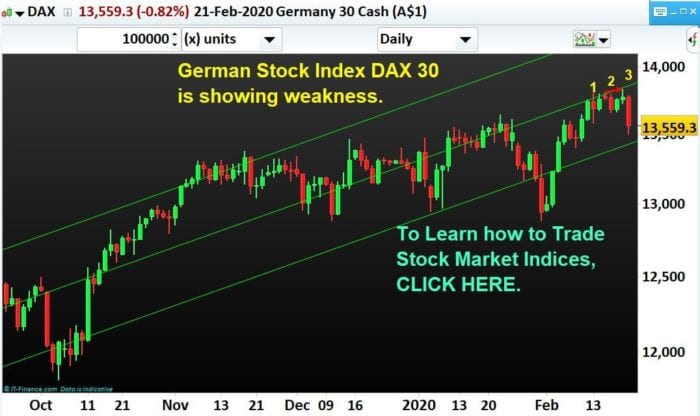
German Stock Index DAX 30 has printed a massive Bearish Engulfing Candlestick in the Daily chart as shown in the chart.
In the last 2 weeks, the price of German Stock Index DAX 30 has printed the following bearish Candlestick patterns back to back:
1. Bearish Engulfing Candlestick pattern on Thursday, 13-February-2020
2. Bearish Evening Star Candlestick pattern on Tuesday, 18-February-2020
3. Bearish Evening Star Candlestick pattern on Friday, 21-February-2020
Important points to note from the chart are as below:
A. Back to back Bearish Candlestick patterns are generally considered strong signal.
B. The high of Bearish Evening Star Candlestick pattern on Tuesday, 21-February-2020 is an absolute high compared to Bearish Evening Star Candlestick pattern on Tuesday, 18-February-2020, but not a relative high as it is below the middle channel line and the high of Bearish Evening Star Candlestick pattern on Tuesday, 18-February-2020 is above the middle channel line.
Considering all of the above points and if the price is going below 13,384 level, we shall maintain a Bearish Bias for German Stock Index DAX 30.
Our price objectives from this Bearish Bias for German Stock Index DAX 30 are as below:
1. 1st price objective is at 13,470 price level.
2. 2nd price objective is at 13,358 price level.
3. 3rd price objective is at 13,250 price level.
4. 4th price objective is at 13,087 price level.
5. 5th price objective is at 12,993 price level.
To take advantage of our proprietary technical analysis and to move to the next level in your trading journey, and to be good at trading the stock market indices, click here.
Our Unique, Proprietary and most accurate Trader Foundation Course has the capability to identify these market turning points at a regular interval which we share with our Paid Clients.
When you are trained by us and learn how to trade Stock Markets Indices by taking advantage of our Knowledge and Expertise in the field, you can be benefited on a regular basis in Stock Markets Indices like Australia 200 (ASX200), China A50 (CHINA50), Hong Kong cash (HK50), Nikkei 225 cash (JP225), France 40 cash (CAC40), Germany 30 cash (DAX30), UK 100 cash (FTSE100), Wall Street 30 cash (WS30) and US SPX 500 cash (US500).
With our Proprietary Trader Foundation Course for Stock Markets Indices like the ASX 200, DJI 30 or DAX 30 Index markets, you can be benefited on a regular basis on ASX 200, DJI 30 or DAX 30 and other Stock Market Indices.
To Trade Stock Markets Indices in the Professional way and to find out the answers to all your Indices Trading related queries, please contact us at 03 9015 4858 and book your FREE discussion session for 30 minutes at Level 3, 2 Brandon Park Drive, Wheelers Hill, Victoria 3150.
Our Post dated January, 27 2020:
Weaknesses can be observed in Australia 200 (ASX200) and Hong Kong 50 (HK50) Stock Indices as of now. Now What to Expect? The question is extremely relevant in the present stock indices markets. Let’s find out the answer through this blog post.
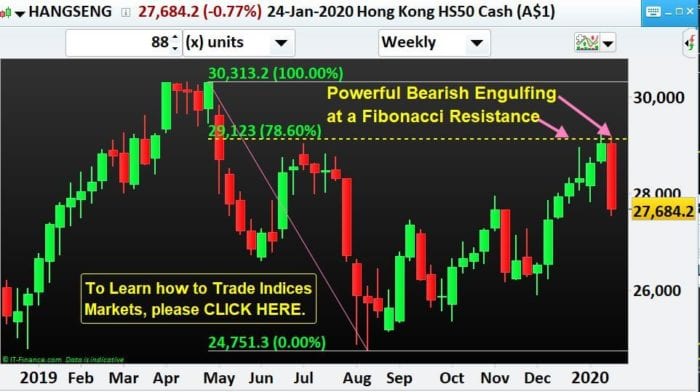
1. Analysis of Hong Kong 50 (HK50) Stock Index:
Hong Kong 50 (HK50) Stock Index has printed a massive Bearish Engulfing Candlestick in the weekly chart as shown in the chart last week (week number 04). This week number 04’s Candlestick can be considered to be a powerful bearish reversal candle since it has engulfed the bodies of week number 52 (2019), week number 01, 02 and 03 (2020). So this weekly Candlestick has covered the last 4 weeks Candlestick’s bodies. This type of Candlestick is considered to be very strong, especially when it appears with a context of an existing resistance. This resistance can be observed at 78.6% Fibonacci retracement level as shown. The Fibonacci is drawn from week number 18’s swing high to week number 33’s swing low. When this happens (Strong Bearish Candlestick appearing at a Resistance) there can be a good probability that the price of this Hong Kong 50 (HK50) Stock Index going down.
2. Australia 200 (ASX200) Stock Index has printed a possible Head and Shoulder in a four hour time frame and a possible Double top in a Daily time frame chart.
a. The Head of the head and shoulder pattern for Australia 200 (ASX200) Stock Index was formed on 22-Jan-2020 15:00 bar at the swing high of 7,155.2 price level.
b. The Right Shoulder of the head and shoulder pattern for Australia 200 (ASX200) Stock Index was formed on 24-Jan-2020 07:00 bar at the swing high of 7,130.2 price level.
c. The Left Shoulder of the head and shoulder pattern for Australia 200 (ASX200) Stock Index was formed on 18-Jan-2020 07:00 bar at the swing high of 7,110.5 price level.
d. The neck line was drawn joining the in-between (between Head and Left Shoulder and Head and Right Shoulder) swing lows of 21-Jan-2020 11:00 bar and 23-Jan-2020 23:00 bar.
e. The last bit was to draw a vertical line from the neck line to the high of the Head and copy-paste the same vertical line on below the neck line when it was broken (i.e. price crossing below the neck line) to get the target of 6,960 as shown below:
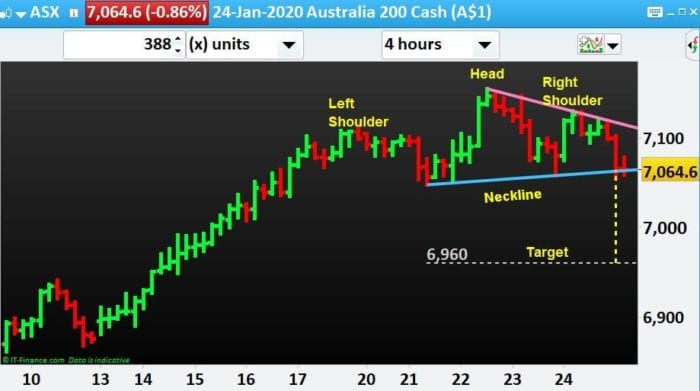
Since both Australia 200 (ASX200) and Hong Kong 50 (HK50) Stock Indices are showing weakness this can be interesting to observe the further move down towards our intended targets.
To take advantage of our proprietary technical analysis and to move to the next level in your trading journey, and to be good at trading the stock market indices, click here.
Our Unique, Proprietary and most accurate Trader Foundation Course has the capability to identify these market turning points at a regular interval which we share with our Paid Clients.
When you are trained by us and learn how to trade Stock Markets Indices by taking advantage of our Knowledge and Expertise in the field, you can be benefited on a regular basis in Stock Markets Indices like Australia 200 (ASX200), China A50 (CHINA50), Hong Kong cash (HK50), Nikkei 225 cash (JP225), France 40 cash (CAC40), Germany 30 cash (DAX30), UK 100 cash (FTSE100), Wall Street 30 cash (WS30) and US SPX 500 cash (US500).
With our Proprietary Trader Foundation Course for Stock Markets Indices like the ASX 200, DJI 30 or DAX 30 Index markets, you can be benefited on a regular basis on ASX 200, DJI 30 or DAX 30 and other Stock Market Indices.
To Trade Stock Markets Indices in the Professional way and to find out the answers to all your Indices Trading related queries, please contact us at 03 9015 4858 and book your FREE discussion session for 30 minutes at Level 3, 2 Brandon Park Drive, Wheelers Hill, Victoria 3150.
We will not only handhold and guide you in the following aspects of the Professional way of Stock Markets Indices Trading but also will actually show you how we Trade Index CFDs for a living:
- Introduction to Trading Different Markets
- Index Market Facts, Timings, and its Framework
- How to take advantage from major Market Participants
- Index Trading Nomenclature
- The relationship between Worldwide Indices
- Dow Jones 30 vs.US Dollar Index
- Swaps, Spread, Slippage
- Fundamentals factors moving Markets
- Order Types, Leverage, Margin
- Trade Risk, Trade Reward, Favorable Reward to Risk
- Account Risk, Basic Position Sizing
- Introduction to Technical Trading
- Index Market Structure
- Market Mechanics and Dynamics
- Market Mapping
- Advance Trade Sizing
- How to identify in advance Market Reversals
- How to evaluate new price action before it unfolds
- Our own proprietary Bar by Bar Market Analysis
- You will come to know What to do & what not to do when
- Our proprietary Money & Risk Management Strategies
- Capital and Portfolio Management System
- Performance Analysis of Bar by Bar Market Analysis
- Professional Trader Mindset including Major Mistakes to be avoided
Now you can trade Share Markets Indices with us to explore the possibility of earning passive income keeping your day job.
Our Proprietary Share Markets Indices Trading Strategies will guide you through every step of your trading in Shares and explore the possibility of earning extra income.
Learn what all other national and international Share Markets Indices we are Trading in our Index Trading Asset Class.
Develop yourself as a professional trader capable of capturing second income in the future with us.
Become a Member to grab these Market Sync based Share Markets Indices Trading Opportunities in the future by clicking here.
Please click on the Contact Us link: Goo.Gl/2SRZoG
Call us on +61 3 9790 6476
email: [email protected]
Learn Share Trading with N P Financials, the Prop Trading Firm at Melbourne
Learn how to Trade the Directional Share Market. Get mentored in the art and science of Share Trading in our proprietary 6 months developmental course. Derive benefit from our effective Share Trading Strategies.
Learn Basics of Forex Trading N P Financials, the Prop Trading Firm at Melbourne
On completion of the “Basics of Trading” course, You will develop an In-depth understanding of Fundamentals factors moving Markets. You will be able to clearly understand the Market Jargon e.g. Swaps, Spread, Slippage etc.
Learn how to Code in Trading N P Financials, the Prop Trading Firm at Melbourne
A full-time professional trader from N P Financials will be your own personal coach for 3-6 months. You will be trained on how to learn the Market Programming Language.
Develop your own Market Scanning System with N P Financials, the Prop Trading Firm at Melbourne
A full-time professional trader from NPF will be your own personal coach for 3-6 months. You will be trained on how to Develop your Market Scanning Edge.
Develop your own Trading System e.g. Stock CFD Trading with N P Financials, the Prop Trading Firm at Melbourne
A full-time professional trader from NPF will be your own personal coach for 3-6 months. You will be trained on how to Build your Trading Edge e.g. Stock CFD Trading

